Andrew Hallam
05.06.2020
Have Netflix and Amazon Investors Gone A Little Crazy?
_
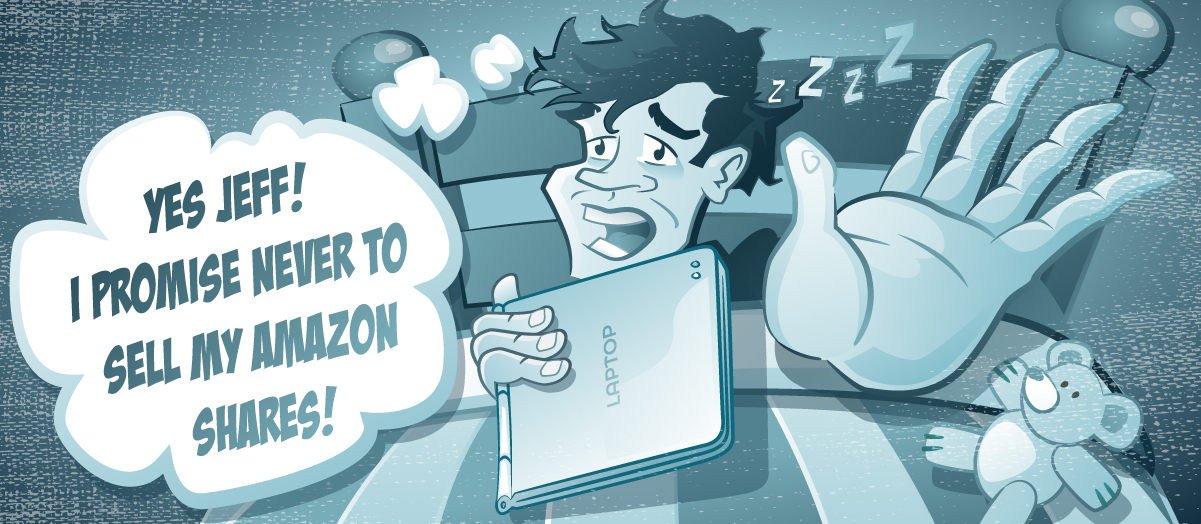
I had a nightmare last night.
Five burley men stormed my home. They dragged me by the hair to my laptop (I often dream about having hair). The biggest guy’s name was Jeff. He screamed, “Log in to your brokerage account! Sell everything! Then invest the entire proceeds into Netflix and Amazon shares! And if you try to sell them before ten years are up, we’ll come back for your scalp!”
I did everything I could to fight them off. I kicked. I punched. I tried to gouge their eyes. Yes, I even bit Jeff. But nothing seemed to work.
Amazon and Netflix are two of the world’s most popular stocks right now. That’s why you probably think I’m nuts. After all, COVID-19’s economic shutdown has been a boon for these businesses. We’re ordering more from Amazon instead of shopping at the mall. We’re curling up with Netflix instead of meeting friends for drinks.
But here’s the scary part. These stocks are expensive…really expensive. And they can’t justify their prices.
According to Yahoo! Finance, on May 15, 2020, Amazon traded at a trailing price-to-earnings multiple of 115 times earnings. Here’s what that means. If you bought every existing Amazon share, it would cost you about $1.2 trillion. Assume you paid that price and then made the company private (much like GEICO, Mars and Ikea are privately held and not publically traded). If Amazon continued to earn the net profits it made in 2019, it would take 115 years to make back the full investment you paid: $1.2 trillion.
It doesn’t take an expert to know that Amazon will have a banner year. COVID-19 has surged online orders. According to Morningstar, analysts assert Amazon’s forward-looking PE ratio will be 97 times earnings for 2020. That’s based on the stock’s current price compared to the profits they expect Amazon to earn in 2020. If that happens, based on Amazon’s current price, it would take 97 years for someone who bought the entire company to recoup their investment if profits remained the same.
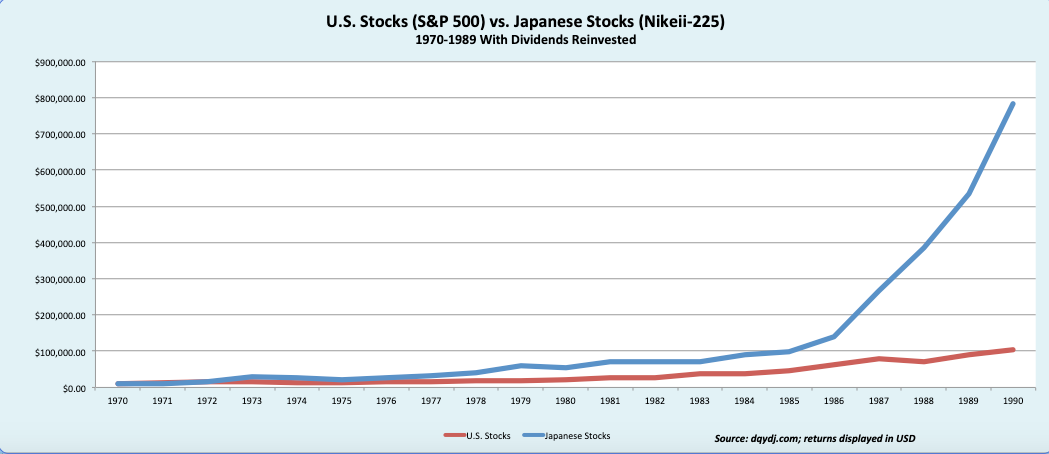
That’s bat-poop crazy. It mirrors the same nosebleed valuations for several technology stocks during the dotcom bubble. It’s twice as expensive as Japanese stocks in 1989, when they hit their bubbling, giddy peak.

In both cases, investors pinned high hopes on the dream that, “This time was going to be different.”
But the laws of economics bit them in the butts.
Netflix shares are similar to Amazon’s. According to Yahoo! Finance, Netflix’s trailing PE ratio is about 92 times earnings. According to Morningstar, the analysts’ forward-looking PE consensus is about 72 times earnings.
Businesses that earn big profits should see their stock prices rise. In other words, if a business tripled its profits over a ten-year period, the stock price should be justified in tripling too.
Consider Apple. Over the past several years its share price rose in line with its business earnings. For example, over the 13 quarterly periods between December 31, 2006 and December 31, 2009, Apple’s PE ratio averaged 24.46 times earnings. On May 15, 2020, Apple’s PE ratio was 24.13 times earnings. This means Apple’s share price rose as fast as its business profits. No more. No less.
That wasn’t the case with Amazon or Netflix. Over the same 13 quarterly periods ending December 31, 2009, Amazon’s PE ratio averaged 66.01 times earnings. But on May 15, 2020, Amazon’s trailing PE ratio was a scorching 115.14 times earnings. This means Amazon’s share price rose 74 percent higher than the company’s rise in business earnings, as measured by earnings per share.
New investors might see that as a cause for celebration. But it’s cause for alarm. As Warren Buffett’s mentor, Benjamin Graham said, “Short-term, the stock market is a popularity contest. But long-term, it’s a weighing machine.” When Amazon steps on the scale, the gauge screams, “Too expensive!”
Netflix investors are also trying to punch too far above their weight. Over the 13 quarters ending December 31, 2009, Netflix shares averaged a trailing PE ratio of 28.02 times earnings. On May 15, 2020, Netflix shares traded at 91.94 times trailing earnings. Like Amazon and Apple, Netflix’s business profits have increased a lot. But their share prices have dramatically exceeded that growth: rising 200 percent faster than the company’s business earnings.
Yes, Amazon and Netflix will probably earn their best-ever business profits this year. But analysts accounted for those projections when they calculated forward-looking PE ratios, which are about 97 times earnings for Amazon and 72 times earning for Netflix. That’s why, in my dream, I punched, kicked and bit the guys who were making me buy these shares.
This doesn’t mean Amazon or Netflix shares are going to crash this year or next. But the timeless rules of economics always humble those who utter, “This time it’s different.”
Trailing PE Ratios December 31, 2006 – December 31, 2009 Compared To May 15, 2020
| Date | Apple’s Quarter- Average Trailing PE Ratio | Amazon’s- Quarter Average Trailing PE Ratio | Netflix’s Quarter- Average Trailing PE Ratio |
|---|---|---|---|
| December 31, 2006 | 21.4 | 87.69 | 36.94 |
| March 31, 2007 | 21.7 | 67.44 | 30.12 |
| June 30, 2007 | 18.02 | 93.71 | 24.87 |
| September 30, 2007 | 13.61 | 107.07 | 24.99 |
| December 31, 2008 | 12.24 | 82.71 | 30.94 |
| March 31, 2008 | 18.65 | 59.42 | 37.25 |
| June 30, 2008 | 28.81 | 53.14 | 23.69 |
| September 30, 2008 | 26.13 | 49.84 | 25.74 |
| December 31, 2008 | 38.62 | 34.19 | 22.31 |
| March 31, 2009 | 34.78 | 46.78 | 28.61 |
| June 30, 2009 | 30.75 | 55.04 | 25.52 |
| September 30, 2009 | 26.19 | 54.92 | 25.51 |
| December 31, 2009 | 27.13 | 66.27 | 27.78 |
| 13 Quarter Average | 24.46 | 66.01 | 28.02 |
| Trailing PE Ratio, May 15, 2020 | 24.13 | 115.14 | 91.94 |
| *Forward-Looking PE Ratios | 22.12 | 97.09 | 71.94 |
Source: Macrotrends.net
* Source: Morningstar
Andrew Hallam is a Digital Nomad. He’s the author of the bestseller, Millionaire Teacher and Millionaire Expat: How To Build Wealth Living Overseas
Swissquote Bank Europe S.A. accepts no responsibility for the content of this report and makes no warranty as to its accuracy of completeness. This report is not intended to be financial advice, or a recommendation for any investment or investment strategy. The information is prepared for general information only, and as such, the specific needs, investment objectives or financial situation of any particular user have not been taken into consideration. Opinions expressed are those of the author, not Swissquote Bank Europe and Swissquote Bank Europe accepts no liability for any loss caused by the use of this information. This report contains information produced by a third party that has been remunerated by Swissquote Bank Europe.
Please note the value of investments can go down as well as up, and you may not get back all the money that you invest. Past performance is no guarantee of future results.
