3.1 Introduction to Technical Analysis
Technical Analysis refers to the use of historical pricing to identify trading opportunities. Learn why traders use this art composed of many variables and discover if it is suitable for you by practising with the charts and indicators of your platform. Want to know more about it?
Complete this course
Script
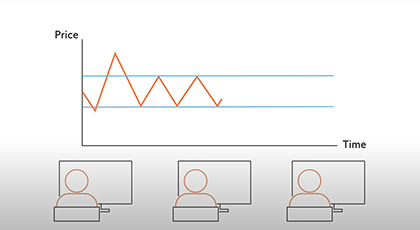
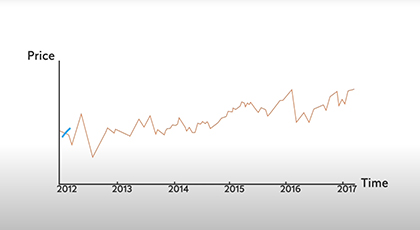
Technical analysis is the use of historical pricing to identify opportunities to trade. You can use technical analysis when trading stocks, forex, CFDs and commodities et cetera. Often, traders combine trading opportunities found through technical analysis with information from fundamental analysis. Some traders use fundamental analysis for long-term analysis, and technical analysis to decide the timing of trades. Others use technical analysis alone. Analyzing prices to predict future price developments is an art with many variables, and each trader has their preferences. Technical analysis is based on three premises. First, that all information known by the market is already part of the price, since anyone with information has already bought or sold accordingly. Second, that prices tend to move in trends and can thus to some degree be predicted. Third, that price movements tend to repeat themselves in various ways, as simple reversals or in more complex configurations.To find out if technical analysis is for you, experiment with the charts of your trading platform. Many commonly used technical analyses are included in your trading platform and can be applied to whatever product you are analyzing. Over time you will find that some indicators are best for alerting you to potential opportunities, others can help you join a price movement, and still others help you trade at opportune moments. Regardless of how you decide to open a trade, remember to define price targets and look for exit signals, too. Often, you can use the RSI indicator included in your trading platform to explore whether a given price movement is firm. In general, when the RSI passes above 70, the asset may be over-bought, implying that it is time to sell; and an RSI below 30 is often an indication to consider a long trade. If you would like to find out more about technical indicators and price movements, watch the more detailed videos about these topics.


